How to Collect User Feedback: 7 Proven Methods
How to Collect User Feedback: 7 Proven Methods
User feedback is essential for creating products people love. Without it, you risk building features nobody needs or ignoring critical problems. This guide covers seven practical ways to gather and use feedback effectively to improve your product and customer experience.
Key Methods:
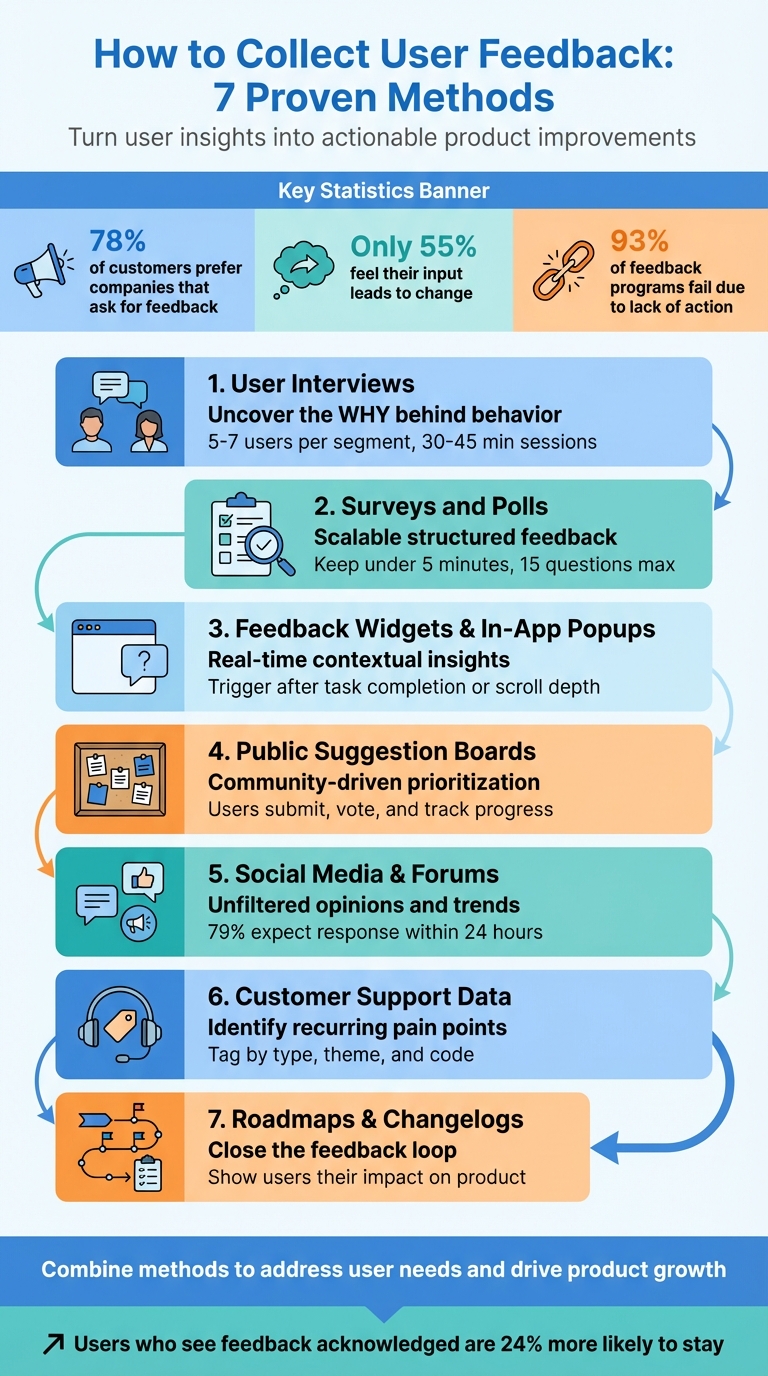
- User Interviews: Get deep insights into user behavior and motivations through one-on-one conversations.
- Surveys and Polls: Collect structured, scalable feedback from a large audience.
- Feedback Widgets and In-App Popups: Capture real-time feedback during user interactions.
- Public Suggestion Boards: Let users submit and vote on ideas to prioritize features.
- Social Media and Forums: Monitor unfiltered opinions and trends in online discussions.
- Customer Support Data: Analyze tickets and interactions to identify recurring issues.
- Roadmaps and Changelogs: Show users how their feedback shapes your product.
Why It Matters:
- 78% of customers prefer companies that ask for feedback, but only 55% feel their input leads to change.
- 93% of feedback programs fail because they don’t act on responses.
- A good feedback system turns insights into action, improving loyalty and retention.
By combining these methods, you can address user needs, make informed decisions, and demonstrate that their voices matter.
6 Ways To Collect Product Feedback
Method 1: Conduct User Interviews
One-on-one interviews can uncover the "why" behind user behavior - something analytics alone can't provide. For instance, while data might show users abandoning your checkout page, an interview can reveal if confusion, frustration, or uncertainty played a role at that exact moment.
Interviews are especially useful during the discovery phase, before any solutions are finalized. They help you understand users' thought processes, challenges, and motivations in their own words. The aim isn't to confirm what you've already built but to figure out what you should build next.
"Stories are where the richest insights lie, and your objective is to get to this point in every interview."
- Steve Portigal, Author of Interviewing Users
You don't need to interview dozens of people to spot patterns. Speaking with 5–7 users from each audience segment is often enough to reach "information saturation", where no new major insights emerge. Keep sessions between 30–45 minutes to allow for detailed discussions without overwhelming participants.
How to Prepare for Interviews
Start with clear research goals and craft conversational questions based on them. For example, if your goal is to understand checkout abandonment, ask, "Can you tell me about the last time you tried to buy something online but didn’t finish the purchase?" Focusing on specific, recent experiences helps participants recall details more accurately.
Use open-ended questions starting with "how", "what", or "tell me about" to encourage storytelling rather than simple yes/no answers. Avoid leading questions that suggest a particular response.
Develop an interview guide rather than a strict script. A guide provides structure around key themes and questions but allows room for exploring interesting tangents. Start with behavioral questions, saving more abstract "why" questions for later, once rapport has been established.
Keep a list of neutral probing questions handy, such as "Can you expand on that?" or "What do you mean by that?" These can help draw out deeper responses when participants give brief or vague answers. The "5 Whys" technique - asking "why" repeatedly - can also help uncover underlying motivations.
Test your guide with a colleague to iron out confusing phrasing or timing issues before interviewing real users. A well-prepared guide ensures smoother sessions and better insights.
How to Analyze Interview Responses
Record sessions so you can focus fully on the conversation instead of taking detailed notes. If you're working with a partner, one person can facilitate while the other takes notes. Afterward, transcribe the recordings using an automated service and review the transcripts multiple times to fully absorb the content.
Coding is the process of tagging segments of data with short labels to identify themes. For instance, you might label one comment as "checkout-confusion" and another as "pricing-clarity." As you code more transcripts, you can group similar codes into broader themes using affinity mapping. These themes represent recurring beliefs, needs, or pain points shared by multiple participants - like consistent confusion about shipping costs being revealed only at the final step.
Maintain a codebook to ensure consistent labels, especially when working with a team. Always tie high-level insights back to specific quotes or session notes to build trust with stakeholders and avoid misinterpretation.
Set time limits for analysis tasks. Block out focused periods for tasks like coding transcripts or grouping codes into themes. Look for concise "sound bites" that can inform marketing strategies, product decisions, or roadmap planning.
Prioritize insights based on their relevance to product strategy, revenue potential, customer experience, and feasibility. While not every finding requires immediate action, all feedback should be stored in a centralized research repository for future reference. This ensures valuable insights remain accessible when needed.
Method 2: Use Surveys and Polls
Surveys and polls allow you to gather structured feedback from large groups, providing measurable insights that complement the depth of one-on-one interviews. While interviews help uncover the "why" behind individual behaviors, surveys reveal how widespread certain issues or preferences are across your user base. For instance, a survey might show that a significant percentage of users struggle with a specific process - insights that can guide resource allocation for improvements.
However, poorly designed surveys can lead to skewed or unusable data. Even a small wording tweak can drastically affect responses. For example, asking about "welfare" versus "assistance to the poor" can yield a difference of over 20 percentage points in support levels [7][9]. Misleading or unclear phrasing introduces biases that even the best analysis can't fix [7].
Survey Design Best Practices
Start with clear objectives. Before drafting questions, define what you want to learn. For example, if you're trying to understand why users cancel subscriptions, every question should align with that goal. Surveys without focus often fail to provide actionable insights [4].
Keep questions simple and precise. Aim for a 6th to 9th grade reading level and avoid vague terms like "often" or "sometimes." Instead, use specific timeframes, such as "in the past 7 days", to ensure consistent interpretation [7][8]. Steer clear of double-barreled questions like "How satisfied are you with our speed and reliability?" - respondents may feel differently about each aspect, making the data hard to interpret [5].
Design answer options carefully. Ensure choices are mutually exclusive and cover all possibilities. For example, avoid overlapping ranges like "1–5" and "5–10", and include options like "Other" or "Not applicable." If more than 10% of respondents choose "Other", it might indicate you missed a key answer choice [6].
Use balanced rating scales with neutral midpoints. A 5-point scale is easier for respondents to process, while a 7-point scale can capture more detailed feedback when needed [7]. Avoid agree–disagree formats, as people often lean toward agreement regardless of their true opinion [8][9].
Structure your survey logically. Start with broad, straightforward questions and gradually move to more specific or sensitive ones. This "funnel technique" helps maintain engagement and reduces early drop-offs [6][9]. Keep surveys short - ideally under 5 minutes or about 15 questions. Longer surveys often see completion rates dip below 50% [6][12]. Limit open-ended questions to one or two at the end to gather additional insights without overwhelming respondents [5][8][10].
Test before launching. Pilot your survey with 5–10 people to catch issues before full deployment. Randomize the order of multiple-choice options to reduce biases like favoring the first or last choice [6][9].
"Great surveys, like other first-rate user experiences, reduce friction and fade into the background" [8]. - Annie Steele, Stripe's first UX researcher
Once your survey is ready, focus on timing and distribution to maximize response rates.
When and How to Distribute Surveys
Follow the "task, then ask" principle: trigger surveys right after users complete a meaningful action, like making a purchase, booking a flight, or submitting a support ticket [15]. This ensures the experience is fresh in their minds.
For email surveys, aim to send them Tuesday through Thursday between 9:00–11:00 am local time, adjusting for time zones [11][14]. Early morning emails (6:00–9:00 am) also perform well as they catch users during their first inbox check [14].
Match your distribution method to the user's context. In-app pop-ups are ideal for gathering immediate feedback during active use, but only after users have spent at least a minute on the page or scrolled through 80% of the content [13]. Email surveys work better for follow-ups after key moments: eCommerce surveys can go out 3–7 days after delivery, SaaS surveys 30 days after a subscription starts, and B2B surveys roughly 3 months after account conversion [14]. This feedback can guide feature updates and broader product strategies.
To avoid survey fatigue, limit how often users are prompted for feedback - once every 3–6 months is a good rule of thumb [14]. Steer clear of major holidays or vacation periods when engagement tends to drop [12]. Interestingly, mobile users show higher weekend engagement (24% compared to 20% for desktop users). If you must send surveys over the weekend, make sure they’re mobile-friendly and brief - under 10 questions [11].
| Distribution Channel | Best Use Case | Consideration |
|---|---|---|
| Reaching known customer lists for detailed feedback | Requires up-to-date email addresses; lower response rates than in-app surveys | |
| In-App Pop-up | Immediate feedback on features or onboarding | High engagement but can feel intrusive if poorly timed |
| Web Link | Broad sharing via social media, chat, or support portals | Harder to control the audience; potential for self-selection bias |
| Website Embed | Continuous feedback on specific pages (e.g., FAQs) | Targets engaged users but may overrepresent frequent visitors |
For quick insights, consider using Modu's poll and rating modules. Single-choice polls are great for simple decisions or gauging preferences, while multiple-choice options let users select all relevant answers. Rating modules, like 1–5 scales, work well for tracking metrics like NPS or feature satisfaction over time. If you need open-ended feedback, text modules provide a private space for users to share detailed thoughts, ideal for bug reports or sensitive suggestions.
Method 3: Embed Feedback Widgets and In-App Popups
Feedback widgets, much like interviews and surveys, offer a way to gather insights - but they do it in the moment, during actual user interactions.
These widgets are embedded directly into the user experience, capturing feedback instantly. Unlike email surveys, they meet users where they are - whether that's on your dashboard, browsing documentation, or finalizing a purchase. By triggering based on user behavior, they collect feedback while the experience is still fresh.
The challenge lies in balancing visibility with user experience. Poorly timed popups can feel intrusive and even harm conversion rates, while overly subtle widgets might go unnoticed. Experts agree that strategic placement can make or break how users engage with these tools.
Modu offers several modules that fit this approach: Text, Rating, and Single/Multiple Choice. For example:
- Rating modules are great for quick sentiment checks, like Net Promoter Scores or satisfaction ratings.
- Choice modules allow users to categorize their feedback (e.g., bug reports or feature requests) with large, tappable buttons.
- Text modules give users space for detailed responses and work best as an optional follow-up.
To make feedback collection seamless, use the "task, then ask" principle. For instance, if you're collecting feedback on your pricing page, trigger the widget after the user has spent 45 seconds on the page or scrolled past 60% of the content. On a dashboard, where users are focused on tasks, consider a passive feedback tab that doesn’t interrupt their workflow.
Research shows that one-question widgets tend to have higher completion rates. Starting with a simple rating or choice question and revealing an optional text field afterward can reduce user fatigue while still gathering valuable insights [16].
Where to Place Widgets for Maximum Engagement
Placement matters. Align the widget location with user intent and how much interruption is reasonable. For high-intent actions, like canceling a subscription or completing a significant task, center-screen modals can work well. On lower-intent pages, such as a homepage, passive tabs or floating buttons are less disruptive.
Here’s a quick breakdown of placement strategies:
- Center-screen modals work best for critical feedback requests.
- Top-center slide-ins are effective for important, but less urgent, prompts.
- Bottom-right tabs are ideal for general-purpose feedback and can remain visible across pages.
For mobile devices, prioritize usability. Buttons should follow guidelines like Apple’s Human Interface recommendation of at least 44x44 pixels for touch targets. Avoid full-screen modals on mobile, which can frustrate users.
Use triggers like scroll depth (50–70%), specific button clicks, or even 90 seconds of inactivity. On desktop, exit-intent triggers (e.g., detecting when the mouse moves toward the close button) can also work, but avoid using these on mobile.
| Page Type | User Intent | Best Placement | Trigger Event |
|---|---|---|---|
| Pricing | Evaluating | Inline (near FAQ) or Slide-in | Scroll depth or 45+ seconds on page |
| Onboarding | Reaching first value | Post-action popup | Completion of a key setup step |
| Docs/Help | Troubleshooting | Inline at end of article | Reaching 70% scroll depth |
| Dashboard | Working | Passive Tab or FAB | Always available |
| Checkout | Committing | Exit-intent (Desktop only) | Mouse movement toward browser close |
To avoid overwhelming users, limit how often widgets appear. Show them only once per session, and if dismissed, wait 7–14 days before prompting again.
How to Customize Feedback Modules
Customization is key to making feedback widgets effective. Start by being clear about what you’re asking and how long it will take. Microcopy like "1 question, 10 seconds" can ease hesitation and encourage participation.
"When we ask someone to do us a favor we will be more successful if we provide a reason. People simply like to have reasons for what they do."
- Robert Cialdini, Influence: The Psychology of Persuasion
For Rating modules, label the scale clearly. Instead of just numbers, add descriptors like "Very Unsatisfied" and "Very Satisfied." Visual elements such as stars or emoji faces can make the process more engaging.
Single and Multiple Choice modules should use large, tappable buttons (not dropdown menus) to simplify responses - especially on mobile. Keep options limited to 4–6 to avoid overwhelming users. Conditional logic can help streamline follow-ups; for example, if someone selects "Unclear pricing", you could ask a follow-up like "What specifically was unclear?"
Text modules are best used as optional follow-ups. After someone gives a rating or selects an option, you can reveal a text field with a prompt like, "What’s one thing we could improve?" Visible character limits can help set expectations, and inline validation (e.g., for email addresses) ensures a smooth process.
Design matters, too. Use high-contrast buttons for primary actions like "Submit" and outlined buttons for secondary actions like "Skip." Always include a visible "No thanks" option to give users control. Ensure widgets respect the user’s system theme (light or dark) while maintaining readability.
Finally, keep forms as short as possible. The best feedback widgets automatically capture context - like browser type, operating system, and URL - so users don’t have to fill in unnecessary details. With tools like Modu, you can keep forms concise (ideally two fields), which helps maintain completion rates above 80%. Short forms also make it easier to analyze feedback and act on it quickly.
Method 4: Create Public Suggestion Boards
Public suggestion boards are a great way to tap into your community's ideas while giving them a voice in your product's development. With tools like Modu's Suggestions module, users can submit their ideas, vote on others, and track progress as requests move through stages like "Planned", "In Progress", and "Shipped." This creates a transparent system where feature priorities are based on actual user demand - not guesswork.
One major benefit is the centralization of feedback. When ideas come in through scattered channels like email, social media, or support tickets, it’s tough to spot trends. A suggestion board consolidates all feedback into one place. For example, if multiple users request the same integration, it becomes immediately clear how popular that idea is.
Of course, high vote counts alone don’t dictate your roadmap. Balancing demand with technical effort, strategic alignment, and overall business impact is crucial. Jesse Sandala, Director of Product at GiveButter, shared how they handled this for their "Auctions" feature, which garnered over 600 votes:
"We assigned the effort score and strategic importance to achieve a more balanced ranking for our roadmap" [21].
Transparency also plays a big role. Showing users the status of their suggestions - even if an idea is marked "Not Planned" - helps build trust. Ida Ström, Senior Product Designer at Mercury, highlighted this point:
"This is something that's not just the support agent experiencing this, but we've seen it across 20 or 30 people. So the voting has been super helpful too" [21].
How to Encourage User Participation
To ensure your suggestion board thrives, you need to actively encourage engagement. An empty board can feel uninviting, so kick things off by seeding it with a few example ideas. This shows users the kind of feedback you're looking for [20].
Promote the board across all your communication channels. Add a link to your website footer, mention it in newsletters, and include it in support team responses. For example, when replying to a feature request via email, you could say: "Great idea! We track all feature requests on our public board at feedback.yourcompany.com. If you post it there, others can vote on it, which helps us prioritize."
Use prompts to guide submissions. Instead of asking something broad like "What do you want?" try more specific questions, such as "What features would make your workflow easier?" or "How could we improve team collaboration?" These prompts encourage actionable suggestions [19].
Don’t forget your internal teams - sales, support, and customer success often hear valuable ideas that never make it to the product team. Make it easy for them to contribute by submitting or voting on suggestions they’ve heard from users [20].
Finally, close the feedback loop. When a suggestion moves from "Planned" to "Shipped", notify everyone who voted for it. Modu simplifies this by automatically sending updates as the status changes, reinforcing that user input matters [18].
How to Identify Trends in Suggestions
Vote counts provide a starting point, but they don’t always tell the full story. For instance, a suggestion with 100 votes might seem important, but if those votes come primarily from smaller accounts while another idea attracts fewer but higher-value users, priorities may need to shift. Segmenting votes by factors like account size or revenue can provide deeper insights [21].
Modu's AI clustering feature takes this a step further by grouping similar suggestions and assigning a "cohesion score" (e.g., 92%) to show how closely related they are [18]. This prevents duplicate ideas from splitting votes and helps you identify overarching trends. For example, if several users submit variations of a "better mobile experience" request, clustering them reveals the collective demand.
To keep your board organized, merge duplicate suggestions, categorize them (e.g., integrations, performance, UI), and archive ideas with no traction after two years. Pay attention to user comments - they often provide context or highlight specific needs. Lastly, track engagement metrics like total page views, unique visitors, and vote counts through Modu's analytics dashboard. These insights help pinpoint which ideas resonate most with your audience [18].
Method 5: Monitor Social Media and Forums
Feedback doesn’t always come through formal surveys or direct messages. Social media platforms, Reddit, and niche forums are goldmines for unfiltered opinions. People often share their thoughts - whether it’s a complaint about a bug on Twitter or a glowing review in a Discord chat - without tagging your brand. These candid insights are just as important as the feedback you actively solicit.
It’s important to understand the difference between monitoring and listening. Monitoring is reactive; you respond to direct mentions or messages. Listening, on the other hand, is proactive. It involves tracking broader conversations, analyzing sentiment, and spotting trends before they become larger issues. Social media consultant Annie-Mai Hodge explains it well:
"Monitoring tells you what people are saying to you. Listening reveals what they're saying about you" [26].
The stakes are high. Research shows that 79% of customers expect a response to a complaint on social media within 24 hours [25]. Companies that actively engage in social listening see 2.4× higher customer retention rates [23]. A great example is Corewell Health, which used Hootsuite Listening during a 2025 rebrand following a hospital merger. By monitoring sentiment across 21 hospitals, they identified spikes in negative feedback, adjusted their messaging in real time, and cut negative sentiment by half. They also generated 3 million impressions through employee advocacy [24].
Which Channels to Monitor
Start with the platforms your audience frequents. For B2B companies, that might include Reddit, HackerNews, or GitHub. For consumer brands, focus on Twitter/X, TikTok, Instagram, and Facebook. Don’t overlook niche communities like Discord servers, Telegram groups, or industry-specific forums - these spaces often host honest, detailed discussions.
Set up keyword tracking for your brand name, product names, executive names, branded hashtags, and even common misspellings [29][28]. For instance, if your product is called "DataSync", track variations like "DataSynch" or "Data Sync." Use Boolean search operators to refine your searches. For example, a query like "YourBrand AND bug" can help you identify technical complaints, while "Competitor Name AND frustrated" might reveal opportunities to address gaps in the market [27].
There are tools for every budget. Google Alerts (free) provides basic web mention tracking. For real-time sentiment analysis, platforms like Brand24 (starting at $119/month) and Mention (starting at $49/month) are great options [22][24]. If you need visual monitoring, YouScan (starting at $299/month) uses AI to recognize your logo in user-generated images [25]. For developers, SociaVault offers API access to over 25 platforms, including Discord and Product Hunt [23].
How to Analyze and Act on Social Feedback
Raw mentions are just the start - you need to organize the data to uncover actionable insights. Break feedback into four categories: sentiment (positive, negative, neutral), trends (recurring topics), pain points (bugs or usability issues), and opportunities (feature requests or unmet needs) [27]. While tools with Natural Language Processing (NLP) can automate sentiment scoring, it’s still worth reading comments manually to fully understand the context.
Set up real-time alerts for sudden spikes in mentions or negative sentiment. These can signal a brewing issue, like a service outage or a viral complaint [23][24]. When responding, prioritize negative feedback first, then questions, and finally positive mentions. For example, Tyler Denk, CEO of Beehiiv, noticed repeated Reddit threads from creators frustrated with a competitor’s pricing. His team used that insight to create targeted campaigns highlighting their migration tools [26].
Close the loop by acting on what you learn. If feedback leads to a product update or fix, announce it publicly and tag the users who raised the issue. This shows you’re not just collecting data - you’re listening and taking action. Connect your monitoring tools to platforms like Zendesk so customer service can turn social mentions into trackable tickets [29]. Share these insights across teams: product teams can address feature requests, marketing can refine messaging, and support teams can prepare for recurring issues [28].
Method 6: Mine Customer Support Data
Your customer support inbox is a goldmine of insights. Every ticket, email, or chat interaction highlights where users are stuck, frustrated, or confused. These interactions naturally uncover what matters most to your customers. The challenge? Turning this flood of information into actionable insights.
When paired with direct user surveys and interviews, analyzing support data provides another clear lens into user challenges. Quantitative metrics like CSAT (Customer Satisfaction Score) or FCR (First Contact Resolution) tell you what's happening. But to uncover the why, you need to dig into the qualitative feedback. As Tim Jordan, Senior Manager of Customer Support at Cars.com, puts it:
"Numbers tell you what's happening. Comments tell you why." [30]
For instance, a sudden drop in CSAT becomes meaningful only when you analyze the related feedback and comments in your support tickets.
Start by consolidating all customer interactions - whether they come from tickets, live chats, emails, or even social media - into a single repository. This ensures nothing gets overlooked. Then, introduce a consistent tagging system. Categorize each interaction by Type (e.g., bug, feature request, usability issue), Theme (specific product area), and a short Code summarizing the issue [34]. Keep your tagging system simple - ideally under 20 categories - for clarity [33]. For example, if users repeatedly say, "I can't export my data", you might tag it as Type: Bug, Theme: Export, Code: CSV export fails. This approach makes it easier to quantify and prioritize issues.
Companies that excel in this area see tangible results. In January 2026, Motel Rocks, an online fashion retailer, used Zendesk Copilot to analyze customer sentiment. By catching recurring frustrations early, they boosted their CSAT by 9.44% and cut ticket volume by half [35]. Similarly, in August 2025, Catapult, an athletic performance company, implemented automated triage tools to prioritize tickets based on urgency and sentiment, slashing their first reply time by 50% [32]. These examples show how turning support data into insights can lead to meaningful improvements.
How to Track Recurring Issues
Recurring complaints are like warning lights on a dashboard - they signal deeper problems that need fixing. Tim Jordan describes this as a "dull whine" that grows louder over time [34]. Grouping tickets by theme and tracking their frequency helps you identify and prioritize these issues. For example, if "password reset not working" pops up multiple times in a single day, it’s a clear sign something’s broken.
A priority matrix can help you decide which issues to tackle first by balancing Impact (how many users are affected) against Urgency (how quickly the issue escalates) [33]. Sentiment analysis tools can also classify tickets as positive, negative, or neutral, allowing you to focus on the most pressing concerns [32][33].
In August 2025, CityGo, a mobility company, monitored 100% of their support conversations using Zendesk QA. This allowed them to pinpoint training gaps and product friction points, achieving a 96% Internal Quality Score [32]. Treating support agents as “feedback translators” is key. Set up an internal channel where agents can flag recurring issues in real time to speed up resolutions [30][33].
How to Use Analytics for Feedback
Behavioral analytics provide another layer of insight by showing how users interact with your product. This complements direct feedback by revealing where users might be silently struggling. Combining these data sources gives you a fuller picture of the user experience.
Track metrics like First Contact Resolution (FCR) and Customer Effort Score (CES) to spot areas where users face challenges [33]. For example, low FCR on a specific feature might indicate it’s confusing or poorly documented. Tools like session replays and heatmaps can also help pinpoint trouble spots. If a customer submits a ticket saying, "I can't find the export button", reviewing their session recording can show exactly where they’re getting stuck [36].
Segmenting feedback by customer type is equally important. High-value accounts often have different needs than occasional users [30][31]. For instance, enterprise customers might repeatedly request SSO integration, while free users focus on features like dark mode. Recognizing these patterns can shape your product roadmap. In 2025, eBay's advertising department used Airtable ProductCentral to centralize over one million pieces of feedback. By automating categorization, they reduced processing time from weeks to near-instant and even generated Jira tickets for engineering automatically [37].
Finally, ensure feedback insights are shared across teams. When product, engineering, and marketing align to address issues, the customer experience improves dramatically. As Larry Barker, CX & Operations Lead at Teamshares, explains:
"Making customer feedback analysis the foundation of your planning and decision-making process - rather than an afterthought - helps you zero in on what truly matters to your customers." [31]
Research supports this approach: 83% of customers feel more loyal to brands that actively resolve their complaints [31]. Integrating these insights into your roadmap can lead to more targeted and effective product improvements.
Method 7: Share Roadmaps and Changelogs
Once you've gathered insights from your users, the next step is to show them their feedback is driving real change. Your users need to see the impact of their input. By sharing what’s in the works and what’s already been delivered, you turn feedback into a visible cycle of improvement. This is where tools like roadmaps and changelogs come into play - they’re essential for closing the feedback loop.
With Modu's Roadmap module, you can organize plans into categories like Backlog, Planned, In Progress, and Shipped. Meanwhile, the Changelog module lets you share updates with titles, descriptions, tags, images, and embeds to illustrate your product's evolution. Together, these tools show users you're not just listening - you’re taking action.
How Transparent Roadmaps Build Trust
A public roadmap is a powerful way to build trust by directly connecting user feedback to your product’s growth. When users see their suggestions progress from "Backlog" to "Planned" to "In Progress", they feel like active participants in shaping the product. This transparency matters: 78% of U.S. customers prefer companies that actively seek and accept feedback, yet only 55% believe businesses follow through on that feedback [3].
To maintain trust without over-promising, focus on big-picture initiatives instead of getting bogged down in specifics. Use general timeframes like "Q3" rather than exact dates to manage expectations. Modu’s Roadmap module even allows you to add optional ETA labels like "Soon" or "Q1 2025", giving users a sense of timing without committing to rigid deadlines. You can also link roadmap items directly to suggestions from your feedback module, creating a seamless connection between user input and your development process.
Feature voting is another way to engage users. When users upvote roadmap items, you get clear data on what matters most to them. This approach, much like surveys or interviews, reinforces the idea that user feedback directly shapes the product. As Changelogfy puts it:
"A transparent roadmap powered by feature voting is more than just a method; it's a statement. It tells your users that you're not only listening but actively involving them in your product's journey." - Changelogfy [39]
And it works: users who see their feedback acknowledged are 24% more likely to stick with your product [40].
How to Close the Feedback Loop with Changelogs
Changelogs are the final step in closing the loop. When you release a new feature, publishing a changelog lets users know their input made a difference. Modu’s Changelog module simplifies this process: you can create entries with titles, descriptions, and tags, and even let users react with emojis to gauge their response. The key is linking each changelog entry back to the original feedback.
Once an item moves to "Shipped", publish a changelog entry that explains the changes and ties them directly to user suggestions. As Carlos Gonzalez de Villaumbrosia, Founder & CEO of Product School, puts it:
"Closing the loop turns collecting product feedback from a transactional ask into an ongoing relationship. Tell people what you heard, what you changed, and what you are still thinking about." [40]
This practice doesn’t just acknowledge users - it turns them into advocates. After implementing a change, reach out to the users who suggested it and let them know their input had a direct impact. This personal approach fosters loyalty and builds stronger connections. As Jesse Sumrak from LaunchDarkly reminds us:
"Software isn't finished when it ships. That's just the beginning of product development." - Jesse Sumrak, LaunchDarkly [38]
Conclusion
The secret to collecting effective feedback lies in how well you integrate various methods. Each approach - whether it's interviews, surveys, real-time feedback, or transparent updates - offers a unique way to understand and address user needs. For example, user interviews uncover the motivations behind behaviors, surveys provide scalable quantitative insights, and feedback widgets capture in-the-moment reactions. Meanwhile, public suggestion boards let your community contribute ideas, social media monitoring reveals unfiltered opinions, support data pinpoints recurring pain points, and roadmaps with changelogs show users that their input truly matters.
The numbers back this up: while 97.7% of product professionals incorporate user feedback, 93% of feedback programs fail because they lack a system to turn responses into actionable steps [1][17]. The key difference? Successfully pairing the right feedback method with the right question - and centralizing all input in one place.
"The best feedback strategy isn't about using every collection method available - it's about matching specific methods to specific product questions, organizing feedback systematically, and closing the loop with users." - Chris Rader, Centercode [2]
This is where Modu shines, bringing all seven feedback methods together in one platform. Whether you're using the Suggestions module for feature requests, deploying in-app polls to measure interest, or publishing changelogs to highlight how user input drives change, Modu simplifies the process. Its advanced integrations ensure that scattered feedback becomes a well-oiled machine for product growth.
Start small by focusing on methods that address your most pressing questions, and expand your efforts as you gain momentum. By systematically applying these strategies, you can align your product roadmap with what users genuinely need. The key is simple: listen, take action, and show users the impact of their voices.
FAQs
Which feedback method should I start with first?
Start with approaches that are simple, scalable, and provide fast insights. Surveys are an excellent starting point - they gather a wide range of feedback quickly and can be customized to target specific areas like user experience or satisfaction. Another effective option is using feedback widgets or in-product surveys, which allow you to capture real-time insights while users are actively engaging with your product. After collecting this initial data, you can dive deeper with methods like user interviews or social media listening to uncover more detailed perspectives.
How do I avoid survey fatigue and low response rates?
To avoid survey fatigue and encourage higher response rates, it’s important to keep surveys short and to the point. Focus on asking only the most essential questions. Timing also matters - send surveys at logical moments in the user journey, such as right after a task is completed, to ensure they feel relevant and non-intrusive.
Consider using micro-surveys with just one or two questions to keep users engaged without taking up too much of their time. Personalizing the survey content and ensuring it’s easy and quick to complete can make a big difference. Lastly, avoid sending too many surveys, as this can overwhelm respondents and lead to lower participation.
How do I turn feedback into product changes users can see?
To transform feedback into real product updates, start by collecting meaningful input using tools like surveys or interviews. Carefully analyze the feedback to uncover common themes and decide which changes best align with your product’s objectives. Share these priorities with your team, roll out the updates, and make sure to inform users about the changes you’ve made based on their suggestions. This approach not only strengthens trust but also motivates users to keep sharing their thoughts.